Live cattle
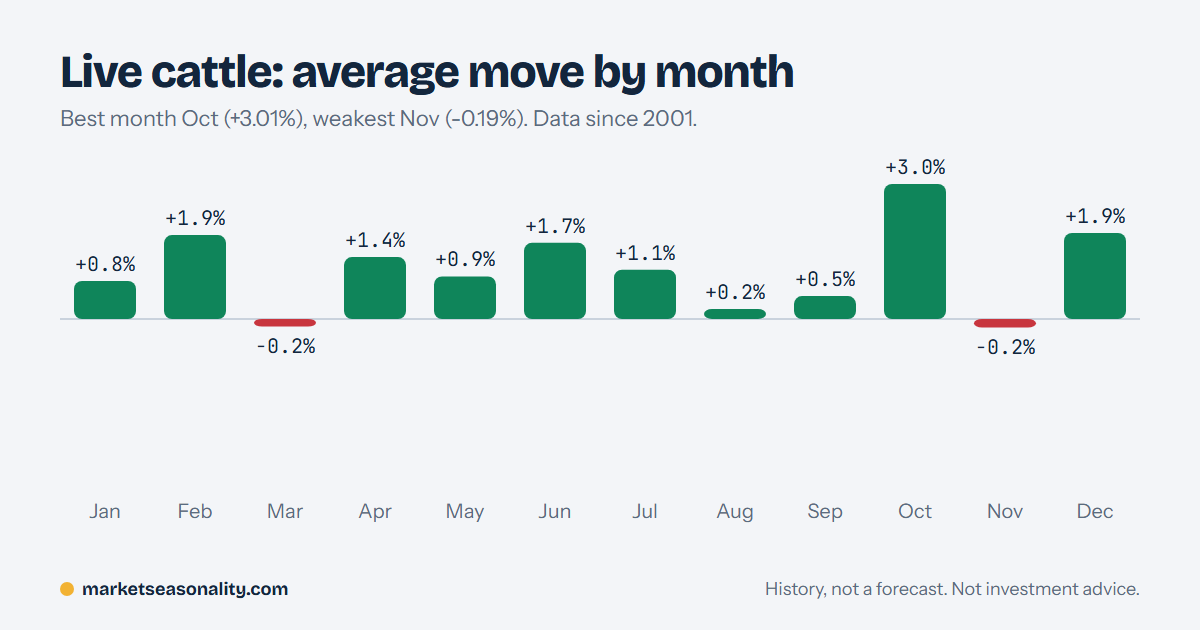
Since 2001, Live cattle has gained most in October (average +3.01%, higher in 73% of 26 years) and done worst in November (-0.19%).
Grades describe the data. They are not buy or sell ratings.
Seasonality
Average return by calendar month, 2001 to 2026
Sell in May: November to April averaged +5.84%, May to October +8.11%; winter did better in 36% of 25 years. Compare markets
Month-by-month table
| Month | Average | Median | Up years | Last 10 years | Best | Worst | Years | Pattern |
|---|---|---|---|---|---|---|---|---|
| January | +0.85% | +0.97% | 65% | +1.26% | +9.15% | -6.55% | 23 | no clear pattern |
| February | +1.87% | +2.87% | 79% | +2.11% | +9.52% | -7.15% | 24 | moderate |
| March | -0.17% | +0.51% | 56% | -0.59% | +8.97% | -8.65% | 25 | no clear pattern |
| April | +1.38% | +0.50% | 54% | +2.56% | +15.05% | -7.43% | 26 | no clear pattern |
| May | +0.95% | +0.79% | 54% | +1.40% | +12.66% | -8.75% | 26 | no clear pattern |
| June | +1.70% | +1.61% | 58% | +2.30% | +10.47% | -6.53% | 26 | no clear pattern |
| July | +1.10% | +0.78% | 58% | +1.01% | +9.73% | -5.29% | 26 | no clear pattern |
| August | +0.22% | +0.15% | 54% | -0.54% | +7.73% | -6.78% | 26 | no clear pattern |
| September | +0.51% | +1.07% | 58% | +1.73% | +9.96% | -11.00% | 26 | no clear pattern |
| October | +3.01% | +2.30% | 73% | +3.23% | +14.70% | -4.89% | 26 | strong |
| November | -0.19% | +0.28% | 50% | -0.05% | +5.59% | -6.94% | 24 | weak |
| December | +1.92% | +2.51% | 84% | +3.79% | +7.62% | -11.79% | 25 | weak |
Chart image and embed code
Ahead or behind the season
This year against the usual move by the same date
Usually higher in this period (92% of 24 years). 49 days in, 43 days left.
Past laggards mostly caught upIn the 9 past years that were also behind on this date, the rest of the period averaged +2.34% and ended higher in 78%.
Seasonal windows
Picked on older years, then checked on the last 10 years
Held in 9 of the last 10 years (2016 to 2025). Those years were not used to pick the window. Any window of this length went the same way in 60% of them.
Held in 7 of the last 10 years (2016 to 2025). Those years were not used to pick the window. Any window of this length went the same way in 62% of them.
Held in 8 of the last 10 years (2016 to 2025). Those years were not used to pick the window. Any window of this length went the same way in 67% of them.
Held in 9 of the last 10 years (2016 to 2025). Those years were not used to pick the window. Any window of this length went the same way in 65% of them.
We test every start date and every length from 10 to 90 days, so some windows look good by chance. To guard against that, we pick windows using the older years only and publish a window only if it also held in at least 6 of the last 10 years, which played no part in picking it. Each square is one year; green means the window worked. All open and upcoming windows
Technicals
50-day average above the 200-day
No active signal today. We watch 52-week highs and lows, RSI extremes and 50/200-day crossovers, and show what followed each in the past.
Year by year
Monthly moves for the last 16 years, most recent first
What drives Live cattle
- The cattle cycle takes years to rebuild herds; summer grilling demand and feed costs matter.
Questions
What is the best month for Live cattle?
Since 2001, October has had the highest average move for Live cattle at +3.01%, rising in 73% of 26 years. December has the highest share of positive years (84%).
What is the worst month for Live cattle?
November has had the weakest average move at -0.19%, rising in 50% of 24 years.
How does Live cattle usually do in November?
Live cattle has averaged -0.19% in November (median +0.28%), rising in 50% of 24 years. We rate the pattern as weak.
Questions, ideas or corrections?
Write to us. We read every email.
Not investment advice. Market Seasonality publishes historical statistics, news summaries and scenario analysis for information and education. Past patterns do not guarantee future results. Nothing here is a recommendation to buy, sell or hold any asset, and scenarios describe possible paths without predicting them. See the disclaimer and methodology.